Analyzing Election Results
Post-midterm voter file information is starting to roll in from each of our priority states, so we thought it’d be a good time to explain how we analyze this data as a part of our process of continuous learning.
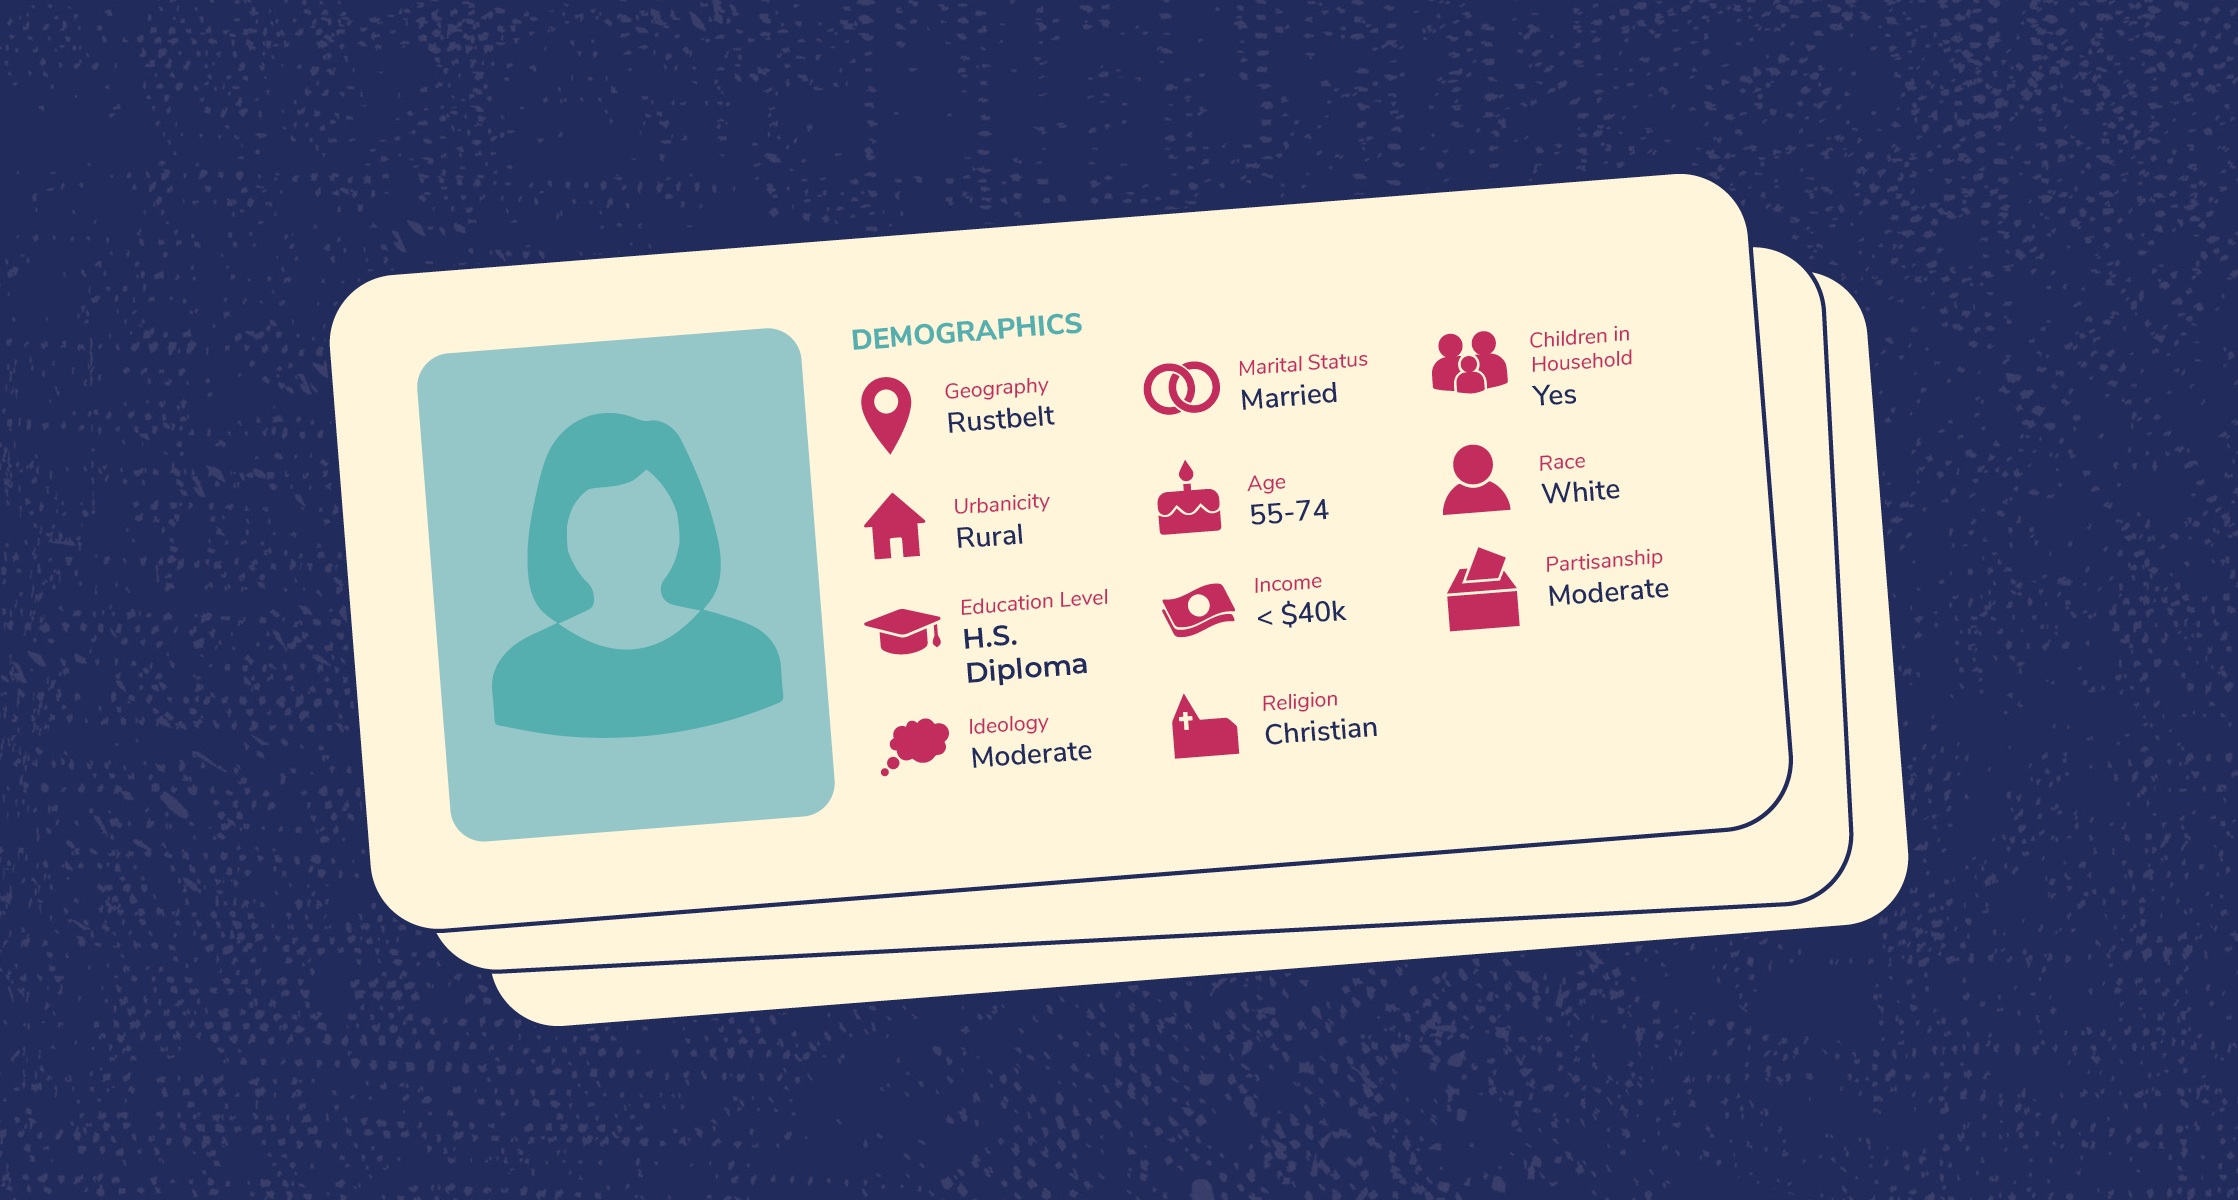
On Election Day, we start looking at CNN exit poll data as soon as polls close along with many of you! These famously imperfect surveys give us an initial look into how folks in different demographics say they voted. For example, exit polls show us that voters shifted to the right between the 2018 and 2022 midterms. They are also how we know that where we worked, white women outperformed their national average.
We then add insights gained from unique research to this existing knowledge. This year, that included questions from the One For All Committee fielded November 4, 2022 to the women in our tracking survey showing the impact of programming. Between exit polls and our own analysis we were able to draw meaningful conclusions shortly after the election.
Next up is a waiting game. Not just for us, but for the field as a whole. Everyone has to wait months to access specific details from updated voter files after an election. These digital databases use publicly-available information to tell us exactly who is registered to vote and whether they cast a ballot. They don’t, however, tell us specifically who a person voted for. But when we pair voter file information with some consumer and modeling data, our award-winning research team can tell us a lot more about how our audience voted. We then dig deeper to find trends, learn the impact of our messaging, and refine our programming based on what we learn. It’s an ongoing cycle that allows us to keep innovating to improve our strategy and impact!


